
Mediation Data
Dashboard
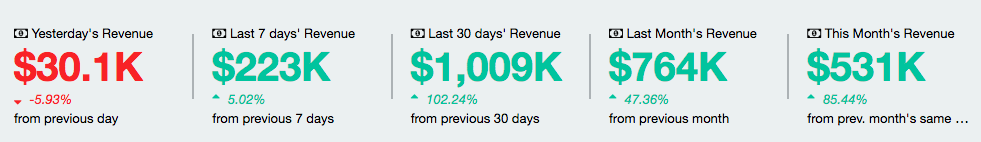
Dashboard panel helps publishers for comparison according to following time periods. You can see revenue comparison between current and previous time periods.
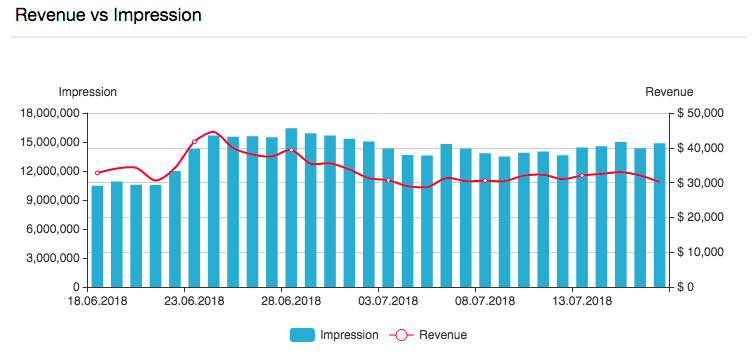
Revenue vs Impression
Publishers can see revenue trajectory in accordance with impression on graphs between dates according to selection.
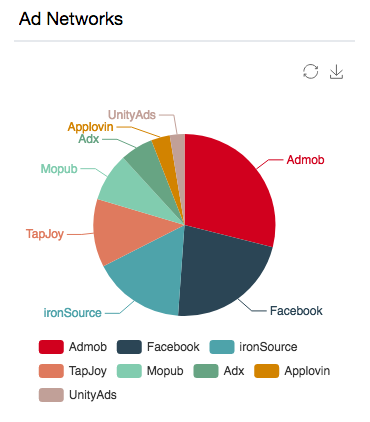
Ad Networks
By pie chart of ad networks, publishers can see ad networks’ revenue and revenue percentage among all.
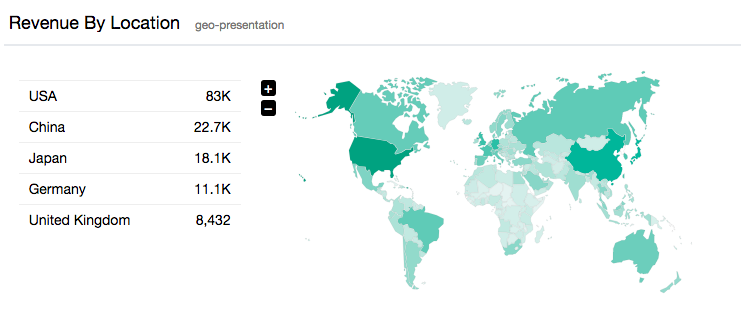
Revenue by Location
This section provides a map of geo-presentation for revenue by location and list of top five countries of revenue rank.
My Apps Panel
Set-up panel that you can create an app, define ad zones and add placements. Also, you can set priorities of ad networks, capping adjustments for time and country and alignment of the waterfall.
Manage Users Panel
You can manage user types. (admin, report)
Manage Testers
You can manage testers with Advertising ID of mobile devices.
Ad Networks Panel
API parameters can be set-up for ad networks and ad networks can be enabled and disabled.
Revenue Report Panel
Admost’s detailed revenue report panel has Apps, Ad Networks, Zones, Countries, Zone Types and Adplace Types filters with a date range that you choose. Also, you can group data daily, weekly, monthly and yearly time intervals and also for filtered features.
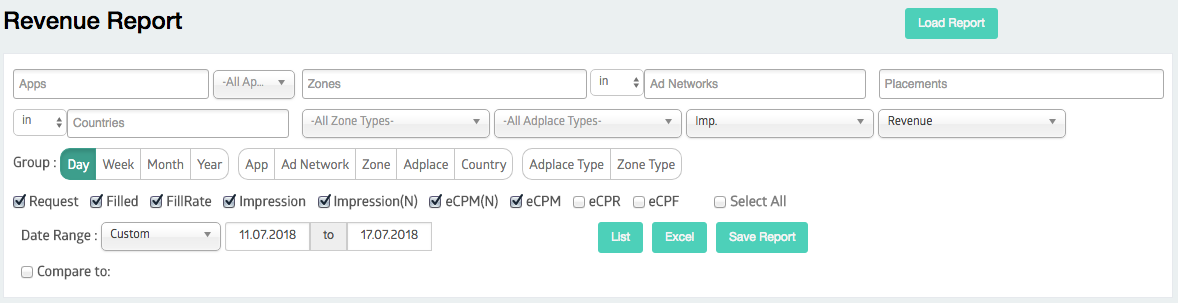
The table that you come across will give you data between dates you determined:
- Request: Number of requests show you how many times ad zone requested for an ad
- Filled: Filled number show you how many times you get an answer for your ad request
- Fill Rate: Percentage of fill by request
- Impression: Impression that counted by Admost Mediation
- Impression (N): Impression that counted by ad networks
- Avg. eCPM(N): eCPM calculated by ad networks
- Avg. eCPM: eCPM calculated by Admost Mediation
- eCPR: Effective Cost Per (1000) Request
Compare to feature: Comparing data between time periods you choose.
Revenue Chart
Revenue chart panel helps you to break down revenue, impression and eCPM values according to options as “Networks”, “Apps”, “Countries” and “Placement Type”.
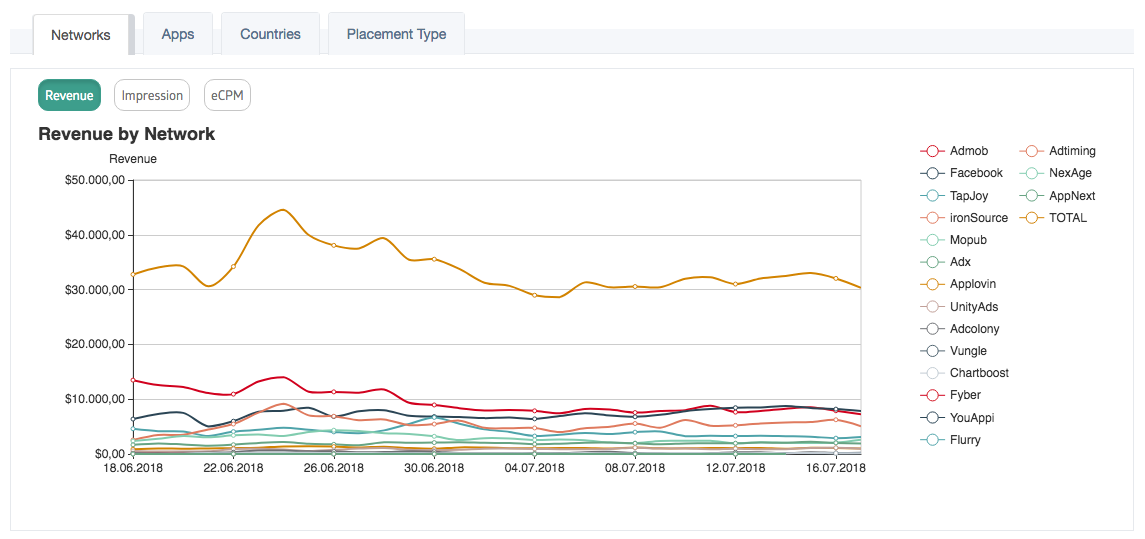
For this panel, you have many options to filter data and date range selection.
![]()