
Retention Analysis
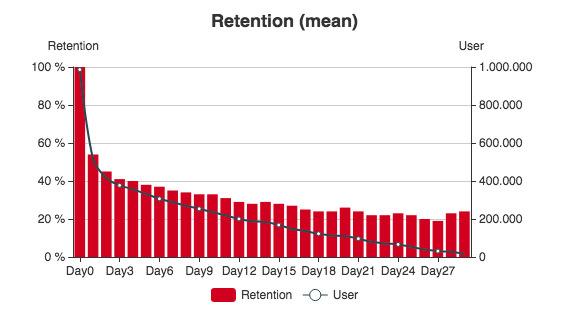
Retention Analysis provides an information about how much users retain since the day installed between a time interval. For a selected time interval, for day 0 retention of users is 100% and you can see how much of them still there for the second day, the third day and so on. The critical point while analyzing retention, you should know that; Day 0 is the install day of all people who installed between the time interval you select.
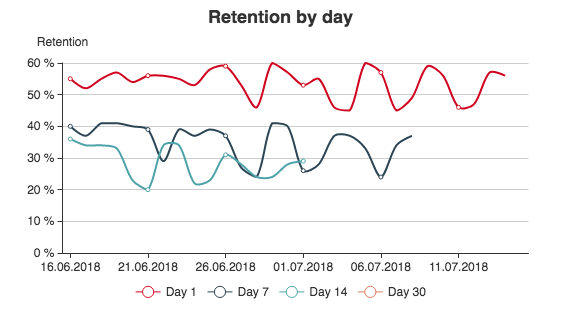
Retention by day graph shows you how many users come back on day 1, day 7, day 14 and day 30 after installing day. By wandering around with your pointer on the graph, you can see how many of users retain since the install date stated on the top of the box.
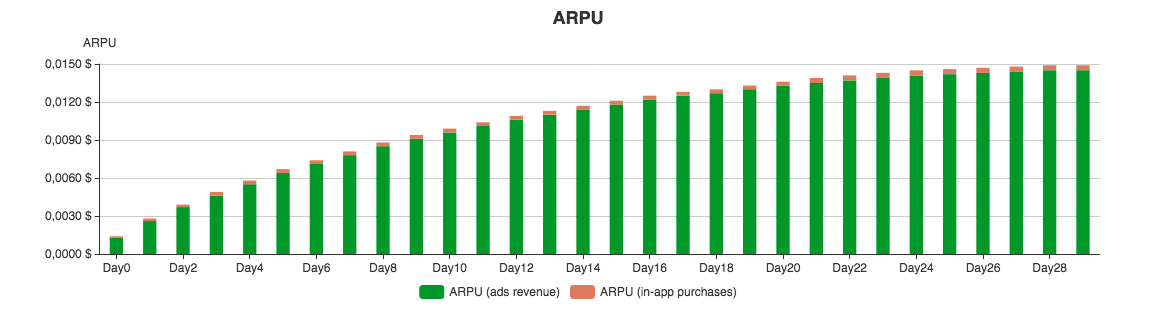
ARPU graph on retention analysis page gives data of average revenue per user who installed between the stated time interval.
By all graphs on this page, you can see retention rate, retention by day and average revenue per user for users who installed between stated time interval, so you can track user behavior changes according to day, country or the date of changes you made on a mobile app, etc.