
Predictive Analytics with a One Click
The growth of the app market directs software improvements toward controlling and predicting. When we examine what we need, the list grows longer and longer. So we started to do something with data that we had, and add many features to our products.
First, it was looking back to see future, we present you extremely detailed Analytics data with ad revenue, then we wanted you to see what is happening right now with Real-Time feature. Now you should catch the newest one; the one is about predicting your apps’ future!

We named it “Show Trends”, by a simple click you can see what will be the ARPU, Retention, User and Install counts for a year by Cohort Analysis. The Cohort Analysis table shows you what is ARPU, Retention, User and Install counts of the cohort of users between the dates you choose day by day. If you want to see beyond what has been done until today, you have a chance to see.
On an introductory basis, you may look the table below to know what is expecting you!
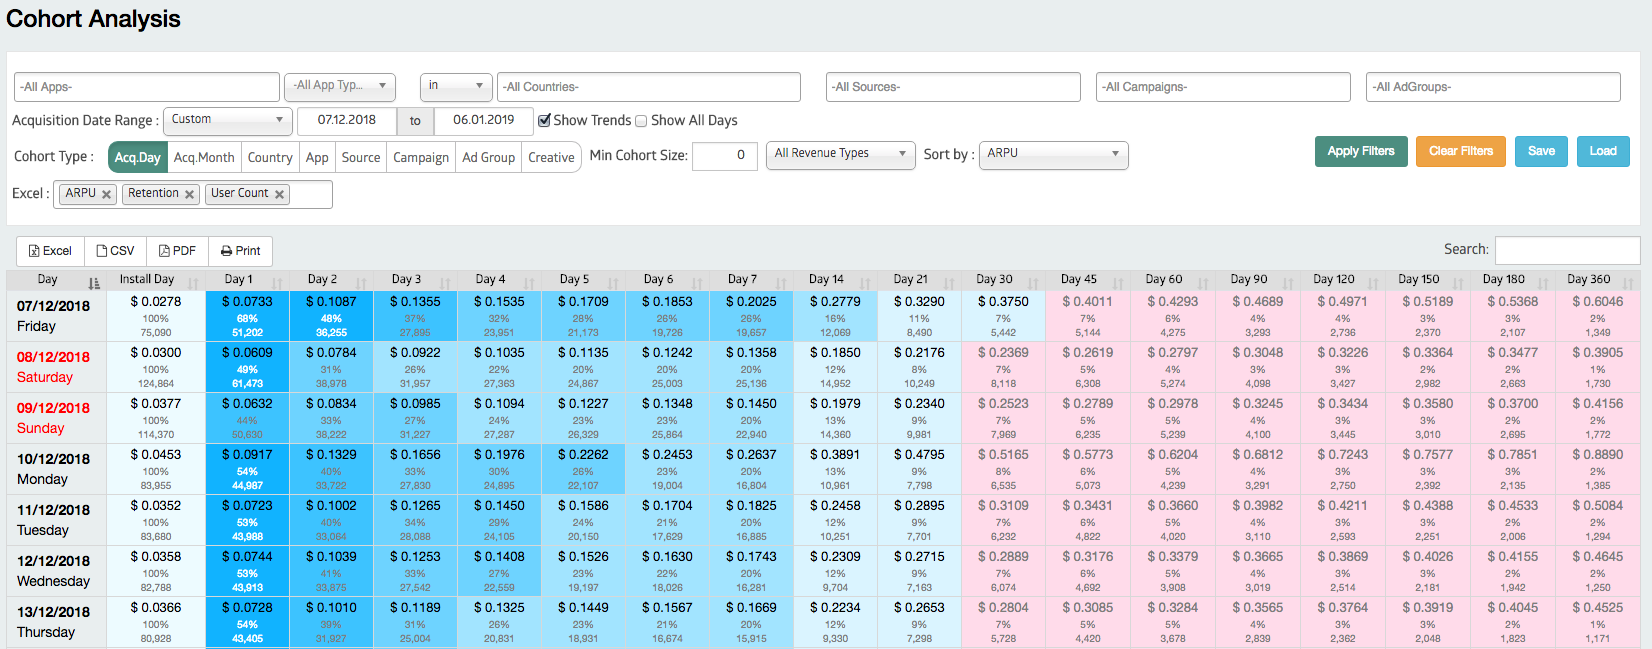
The pink cells show an estimation of what is going to happen. The secret of estimation hides behind mysteries of math. Our qualified team studied hard to reach the most probable consequences, tried many methods and work on statistics. Machine Learning became involved in and here we are!
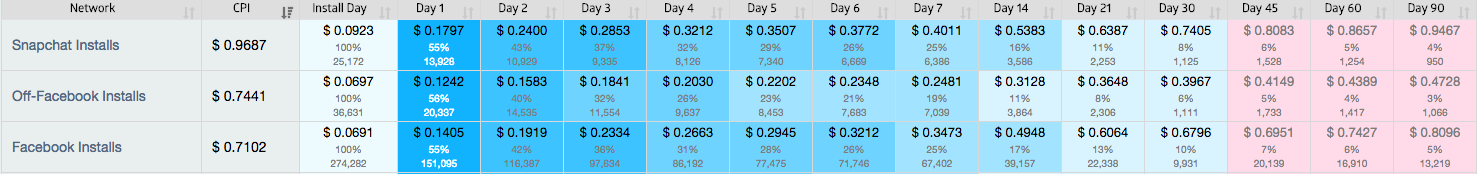
The important thing is when you understand how to use Cohort Analysis Table, you can invest right. With filter options, you can find out which country, source, campaign, ad group even which creative brings you more steady users.
Furthermore, you can integrate your costs into this analysis to compare your expenses with income for next moves.
If you have Admost and Adjust together, these data are not far from you, you can see the magic ball and ask what is going to happen with one click!